
USD/CAD Technical Analysis: Why CAD May Not Slow Down
Talking Points:
- USD/CAD Technical Strategy: Ichimoku Cloud Now Acting As Resistance
- USD/CAD Below 1.3400; 1.3363 Dec. 7 Low As Support
- Oil Direction Increasingly Volatile As Trader’s Question If Feb. 11 Was The Low
A Behavioral Change on the Horizon?
The Canadian Dollar is having a banner run as price continues to push away from the Mid-January peak in USD/CAD. At the same time that CAD has gained nearly 5% on the Japanese Yen & 4.25% on the EUR in the last 5-trading days, the price of WTI Crude Oil continues to push against significant price resistance around 34.50/bbl. The historical correlation of Oil & USD/CAD has diverged somewhat recently from its prior lock-step relationship, but they could pick back up if Oil’s rise could be seen benefitting the Canadian Economy and altering the Bank of Canada’s Monetary Policy. For our long-term Oil Outlook, check it out here.
Weekly USD/CAD Chart May Favor A Deeper Retracement Than Originally Expected
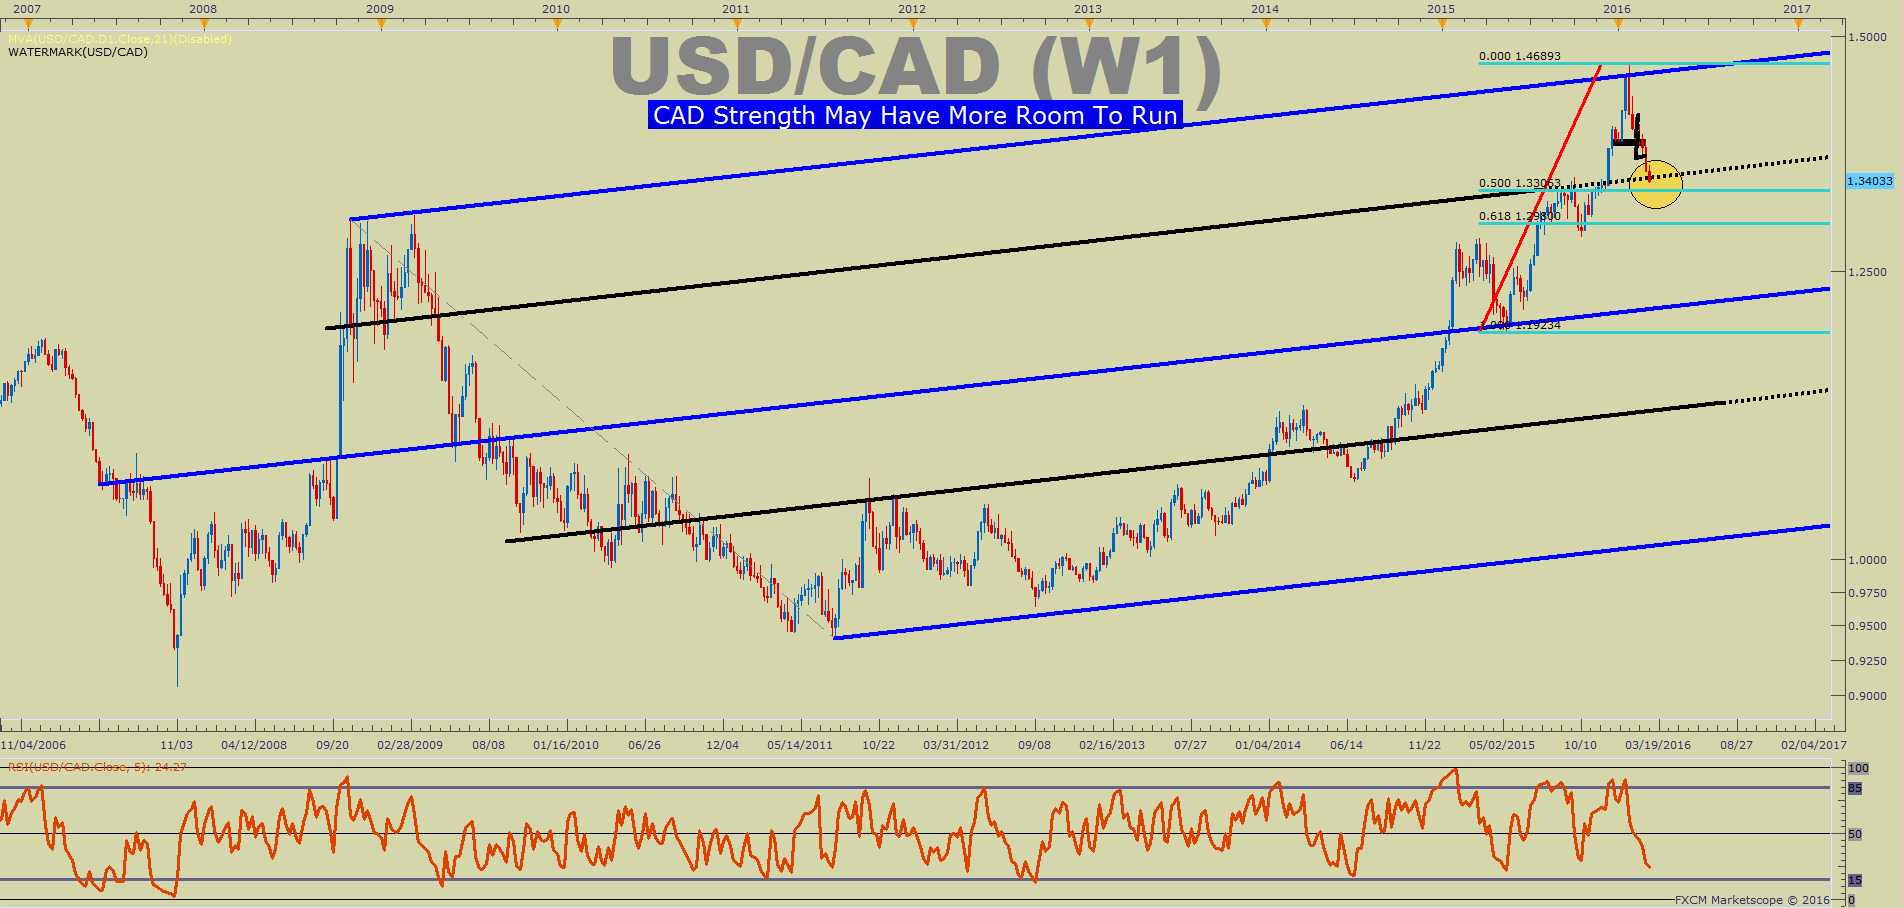
One development that continues to get little attention but appears to be very important to the direction of USD/CAD is the 2-yr yield spread between the United States & Canada. Today, the Canadian government printed a strong GDP YoY at 0.5% vs. exp of 0.0%, and the CAD strengthened further. At the same time, investors are wondering if the Federal Reserve will have to convince the markets that they do not intend to hike in 2016, which would further narrow the important 2-yr spread that has guided USD/CAD lower since mid-January. The 2-yr yield spread has narrowed from -60bp to -26.4 currently, which is a 3-month low in recent trading.
USD/CAD Has Broken Below 1.3400, And Price Now Faces The Q3 2015 Corrective Zone